How to Use Benchmarking Data to Improve Hiring Efficiency in 2025


Benchmarking data has become a game-changer in recruitment. It allows you to measure your hiring performance against industry standards, helping you identify areas for improvement. For example, the average cost per hire is $4,700, and filling a position takes 42 days on average. By comparing your metrics to these benchmarks, you can uncover inefficiencies and refine your strategies. In 2025’s competitive job market, leveraging tools like applicant tracking systems and HR analytics software ensures you stay ahead. These tools not only automate processes but also provide insights into what makes a successful hire, from cultural fit to retention rates. Understanding how to use benchmarking data to optimize your hiring process empowers you to make smarter, faster decisions.
Key Takeaways
Benchmarking data lets you compare your hiring to others. It shows where you can do better.
Tools like applicant tracking systems make hiring easier and faster. They also help keep candidates interested.
Treating candidates well is very important. A good experience makes your company look better and brings more referrals.
Check your hiring numbers often, like cost per hire. This helps make sure your hiring matches your business needs.
Use AI and smart tools to make better choices. These tools can also help remove unfairness in hiring.
How to Use Benchmarking Data to Optimize Your Hiring Process
Defining benchmarking data in recruitment.
Benchmarking data in recruitment refers to the practice of comparing your hiring metrics with industry standards to evaluate performance. It helps you identify gaps, set realistic goals, and improve your hiring strategies. For example, metrics like time-to-fill, cost per hire, and quality of hire are commonly used benchmarks. According to OneUp Research 2024, these metrics are derived from data collected across 200 permanent recruitment agencies, ensuring their reliability.
Metric | Description | Source |
|---|---|---|
Recruitment Benchmarking | Comparing an agency's performance with top organizations. | OneUp Research 2024 |
Key Metrics | Includes time-to-fill, quality of hire, and cost per hire. | OneUp Research 2024 |
By understanding these benchmarks, you can measure your recruitment efficiency and align your processes with industry best practices.
Why benchmarking is essential for hiring efficiency.
Benchmarking is essential because it provides objective data to guide your decisions. It allows you to assess your recruitment process, identify inefficiencies, and implement improvements. For instance, organizations using predictive analytics are 2.5 times more likely to outperform their peers financially, according to a Deloitte study. Benchmarking also helps you stay competitive by identifying trends and designing effective HR programs.
It ensures HR practices align with business outcomes.
It highlights areas for improvement in recruitment and retention.
It enhances employer branding by improving employee experience.
When you use benchmarking data, you can make evidence-based decisions that improve hiring efficiency and support your organization's goals.
The impact of benchmarking on recruitment outcomes in 2025.
In 2025, benchmarking will play a critical role in shaping recruitment outcomes. Companies leveraging benchmarking data have already seen significant results. IBM reduced employee turnover by 30% using predictive analytics, while Google increased hiring effectiveness by 30% through streamlined recruitment pipelines. Unilever sped up its hiring process by 75% and improved diversity by using AI-driven candidate assessments.
These examples highlight how benchmarking can transform recruitment. Tracking metrics like candidate experience and quality of hire allows you to refine your strategies. For instance, measuring Candidate Net Promoter Score (cNPS) helps you understand how likely candidates are to recommend your hiring process, which directly impacts your employer brand.
Metric | Description |
|---|---|
Candidate Experience | Tracks feedback to identify disengagement points. |
Candidate Net Promoter Score (cNPS) | Measures candidate satisfaction and employer brand strength. |
Quality of Hire | Evaluates hires based on performance, retention, and cultural fit. |
By using benchmarking data effectively, you can achieve better recruitment outcomes and maintain a competitive edge in 2025.
Key Metrics for Benchmarking Hiring Efficiency

Time-to-fill and its role in recruitment success.
Time-to-fill measures the number of days it takes to hire a candidate from the moment a job is posted until an offer is accepted. This metric plays a critical role in recruitment success because it directly impacts your ability to secure top talent. A shorter time-to-fill often reflects an efficient hiring process that keeps candidates engaged and reduces the risk of losing them to competitors.
Tip: Tracking time-to-fill helps you plan better for workforce needs and allocate resources effectively.
Evidence | Description |
|---|---|
Time to fill | Indicates the total calendar days required to hire a candidate. |
Budget Implications | Longer hiring times can increase costs and strain budgets. |
Workforce Planning | Helps ensure timely resource allocation and business continuity. |
To improve this metric, consider streamlining your interview process or leveraging automation tools. For example, companies with faster hiring processes often use applicant tracking systems to reduce delays and improve communication with candidates.
Cost per hire and budget optimization.
Cost per hire evaluates the total expenses involved in recruiting a new employee, including advertising, recruitment software, and onboarding. This metric is essential for budget optimization, especially when resources are limited. According to recent data, 68% of HR professionals prioritize reducing hiring costs, yet only 29% report an increase in their talent acquisition budgets.
A major retail chain successfully reduced its cost per hire from $6,000 to $3,200 by automating its hiring platform and negotiating better deals with job boards. This approach not only saved millions but also decreased the time-to-hire by 40%.
Note: Monitoring cost per hire ensures you allocate your budget wisely without compromising the quality of your recruitment process.
Quality of hire as a long-term performance indicator.
Quality of hire measures how well new employees perform and integrate into your organization. This metric reflects the effectiveness of your hiring process and its alignment with long-term business goals. Companies often assess quality of hire through metrics like employee performance ratings, retention rates, and time to productivity.
Metric | Description |
|---|---|
Employee Performance Ratings | Tracks how well new hires perform in their roles over time. |
Retention and Turnover Rates | Indicates workforce stability and the success of onboarding efforts. |
Time to Productivity | Measures how quickly new hires reach full productivity. |
Hiring Manager Satisfaction | Reflects the satisfaction of managers with the hiring process and outcomes. |
By focusing on quality of hire, you can ensure that your recruitment strategies contribute to long-term success. This metric also helps you identify areas for improvement, such as refining job descriptions or enhancing candidate assessments.
Candidate experience and its influence on employer branding.
Candidate experience plays a crucial role in shaping your employer brand. It reflects how candidates perceive your company during the hiring process. A positive experience can enhance your reputation, while a negative one can deter top talent from applying. In today’s competitive job market, candidates evaluate companies as much as companies evaluate them.
Research shows that 75% of candidates consider employer branding before applying for a job. Many also rely on platforms like Glassdoor, with 86% checking ratings before submitting applications. If your company has poor reviews, 55% of candidates may choose not to apply. These statistics highlight the direct link between candidate experience and your ability to attract talent.
Statistic | Percentage |
|---|---|
Candidates considering employer branding before applying | 75% |
Candidates checking Glassdoor ratings before applying | 86% |
Candidates who do not apply to companies with poor Glassdoor ratings | 55% |
Candidates who say a positive experience raises referral chances | 66% |
Candidates indicating overall experience reflects company value | 78% |
Candidates stating experience can change opinion of a company | 85% |
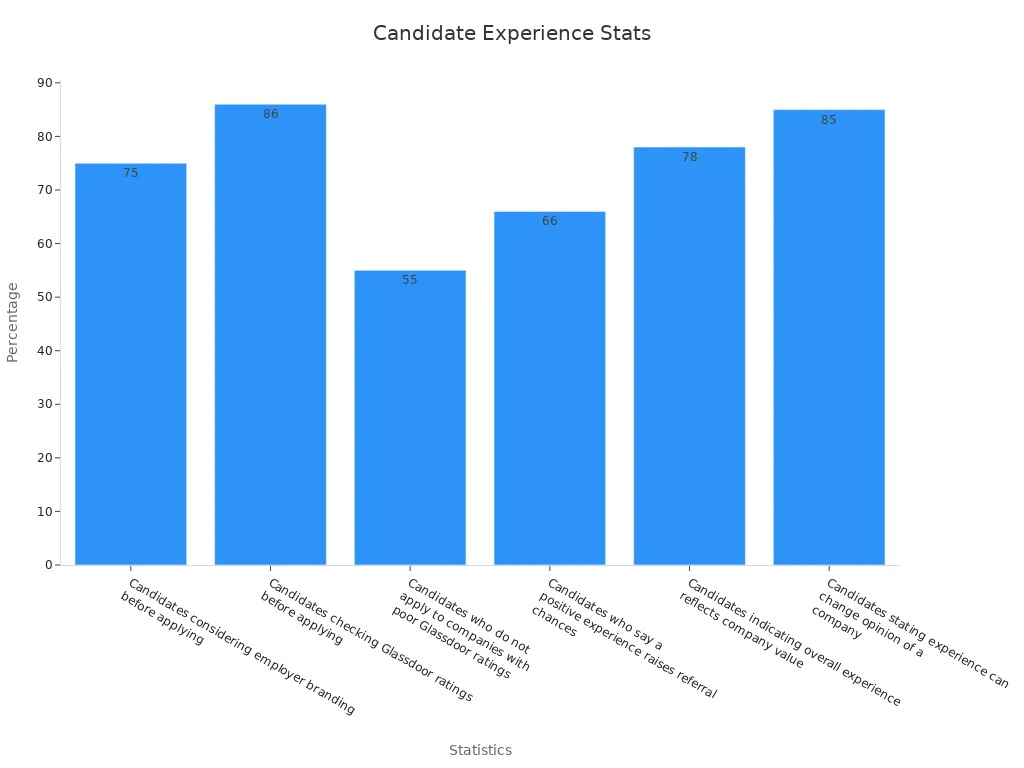
A positive candidate experience does more than attract applicants. It increases the likelihood of referrals, with 66% of candidates saying they would recommend a company after a good experience. Additionally, 85% of candidates report that their experience during the hiring process can change their opinion of a company, either positively or negatively. This means every interaction, from job postings to interviews, reflects your company’s values.
To improve candidate experience, focus on clear communication, timely updates, and a streamlined application process. These efforts not only enhance your employer brand but also help you build trust with potential employees. A strong employer brand, in turn, ensures you remain competitive in attracting top talent.
Steps to Benchmark Your Hiring Process
Collecting and analyzing internal recruitment data.
To start benchmarking your hiring process, you need to gather and analyze internal recruitment data. This step helps you understand your current performance and identify areas for improvement. Use tools like applicant tracking systems (ATS) to streamline data collection. Platforms such as LinkedIn or Indeed can provide insights into job posting performance. Centralize employee data using a Human Resources Information System (HRIS) for better analysis.
Follow these steps to ensure effective data collection:
Define your recruitment goals by identifying pain points and aligning them with business objectives.
Use the SMART framework to set detailed and measurable goals.
Prioritize data quality by ensuring consistency and accuracy in your collection methods.
For a comprehensive analysis, focus on metrics like cost per hire, time-to-fill, and candidate experience. These metrics provide a clear picture of your hiring efficiency and highlight areas that need attention.
Comparing metrics with industry benchmarks.
Once you have your internal data, compare it with industry benchmarks to evaluate your performance. This comparison helps you understand where you stand in the competitive landscape. For example, the average cost per hire is $4,700, and the average time-to-fill is 42 days. If your metrics deviate significantly, it may indicate inefficiencies in your process.
Here’s a table of key benchmarks to guide your comparison:
Metric | Description |
|---|---|
Cost per hire | Average cost to fill an open position, calculated by dividing total hiring costs by the number of hires. |
Source of hire | Tracks how many hires come from which sourcing channels, measured by the percentage of hires from sources. |
First-year attrition | Measures employees leaving within the first year, important for assessing hiring process effectiveness. |
Offer acceptance rate | Indicates the percentage of job offers accepted by candidates. |
Candidate experience | Assesses how candidates perceive the recruitment process, impacting future applications. |
Age of job | Indicates how long job ads remain open, signaling potential issues in the recruitment process. |
Quality of hire | A complex metric that can include retention rates and new-hire performance to evaluate hiring success. |
By comparing your metrics to these benchmarks, you can identify where you excel and where you need to improve.
Identifying gaps and areas for improvement.
After comparing your metrics, focus on identifying gaps in your hiring process. Look for areas where your performance falls short of industry standards. For example, if your time-to-fill is longer than average, it could indicate inefficiencies in your recruitment pipeline. Similarly, a low offer acceptance rate might suggest issues with your compensation packages or employer branding.
Common gaps include:
Difficulty recruiting for roles requiring new skills like data analysis or artificial intelligence.
A lack of long-term talent acquisition strategies to align hiring with business goals.
Outdated recruitment tactics that fail to attract top talent.
To address these gaps, create a plan that includes targeted improvements. For instance, use predictive analytics to refine your hiring strategies or collaborate with AI tools to reduce bias. Continuously evaluate your process and adjust based on feedback and data insights. This approach ensures your hiring process remains efficient and competitive.
Tools and platforms for effective benchmarking.
Using the right tools and platforms can transform your recruitment benchmarking process. These solutions help you collect, analyze, and compare data efficiently, enabling you to make informed decisions.
One of the most reliable platforms is iCIMS, which has revolutionized recruitment strategies for many organizations.
Michele Posehn, Senior Manager of Diversity and Early Talent Initiatives at SiteOne, said: “iCIMS has been the catalyst for change in our recruitment strategies. Our success story with iCIMS continues to unfold, promising growth, and we are excited to see where it leads us.”
iCIMS offers several features that make it a top choice for benchmarking:
It helps organizations hire at scale and speed.
It uses patented AI technology to enhance applicant tracking systems (ATS).
It simplifies offer management and provides collaborative onboarding software.
It includes a dedicated internal mobility platform to retain talent.
For recruitment agencies, OneUp is another excellent option. It provides focused data insights that help agencies grow and improve their hiring processes. If your organization prioritizes skills-based hiring, iMocha is a great choice. It uses a skills-first approach to identify the best candidates for your roles.
OneUp delivers targeted insights for recruitment agencies.
iMocha focuses on skills-based hiring for large organizations.
These tools not only streamline your recruitment process but also ensure you stay competitive in a data-driven hiring landscape. By leveraging platforms like iCIMS, OneUp, and iMocha, you can optimize your hiring strategies and achieve better outcomes.
Strategies to Improve Hiring Efficiency Using Benchmarking Data
Automating recruitment processes for better efficiency.
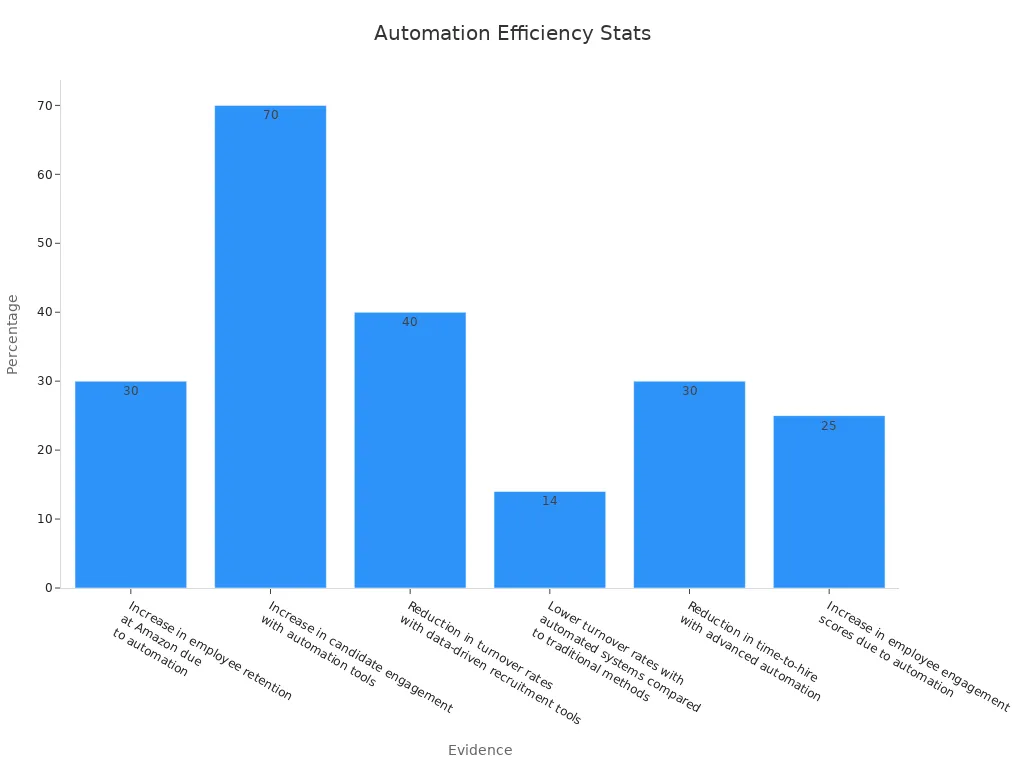
Automation has revolutionized recruitment by streamlining repetitive tasks and improving efficiency. Tools like applicant tracking systems (ATS) and AI-powered platforms can handle tasks such as resume screening, interview scheduling, and candidate communication. For example, automation reduced Amazon's employee turnover by 30%, according to Harvard Business Review. LinkedIn reports a 70% increase in candidate engagement when automation tools are used effectively.
Automated tools also significantly reduce time-to-hire. Advanced platforms like HackerEarth can filter candidates quickly, cutting manual screening time. For tech roles, where the average time-to-fill is 30-45 days, automation can reduce this to as little as 14 days for top companies. This efficiency ensures you secure top talent before competitors.
Evidence Description | Statistic | Source |
|---|---|---|
Reduction in time-to-hire with advanced automation | 30% | |
Increase in candidate engagement with automation tools | 70% | |
Increase in employee retention at Amazon due to automation | 30% | Harvard Business Review |
Leveraging data to reduce unconscious bias.
Unconscious bias can hinder diversity and inclusivity in hiring. Leveraging data ensures a fairer recruitment process by focusing on objective criteria. AI algorithms analyze candidate qualifications without being influenced by factors like gender, ethnicity, or age. Predictive analytics uses historical data to assess candidates based on skills and experience, reducing biases like the halo effect.
Standardized interview processes also play a key role. By asking all candidates the same questions, you minimize informal biases. Continuous monitoring of hiring outcomes helps identify patterns of bias, allowing you to take corrective actions. These data-driven strategies promote inclusivity and ensure all candidates are evaluated fairly.
AI-powered screening tools evaluate candidates using consistent criteria.
Predictive analytics focuses on skills, not personal characteristics.
Standardized interviews reduce the impact of informal biases.
Enhancing candidate experience through actionable insights.
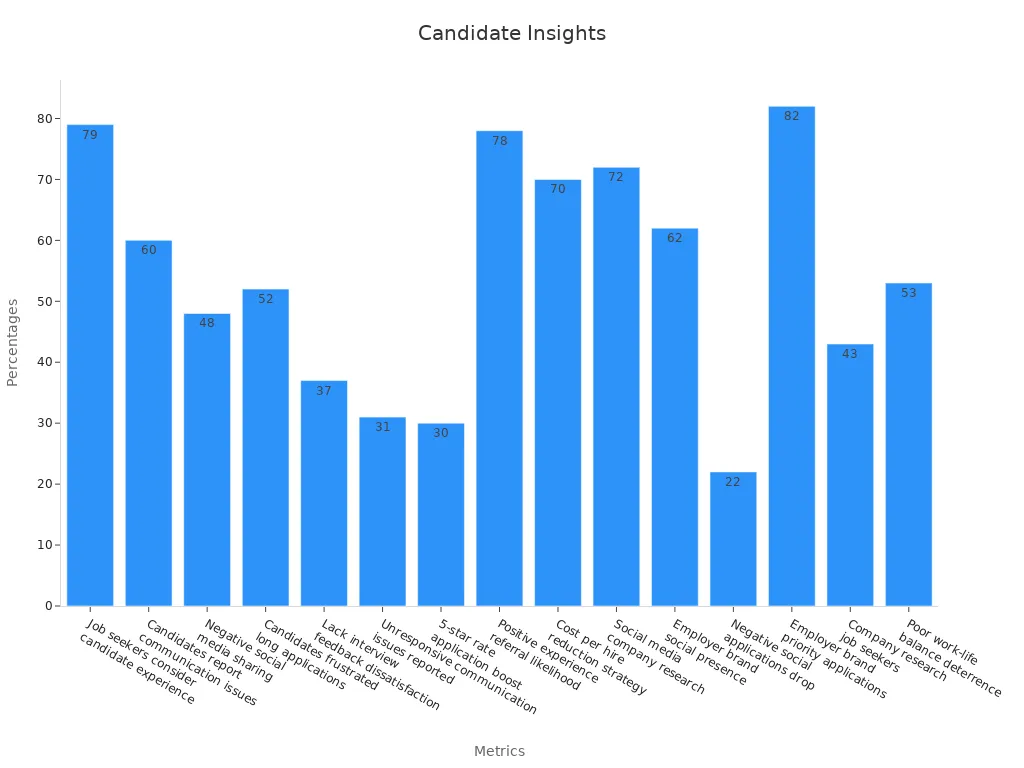
Candidate experience directly impacts your employer brand and hiring success. Research shows that 79% of job seekers consider candidate experience when deciding on job offers. Poor communication frustrates 60% of candidates, while lengthy application processes deter 52%. Actionable insights from benchmarking data can help you address these pain points.
For example, tracking metrics like Candidate Net Promoter Score (cNPS) highlights areas for improvement. Streamlining application processes and providing timely feedback enhances the overall experience. A positive experience increases referral rates, with 78% of candidates likely to recommend a company after a good hiring process.
Statistic | Value |
|---|---|
% of job seekers considering candidate experience in job offer decisions | 79% |
% of candidates frustrated by lengthy application processes | 52% |
% of candidates likely to refer others after a positive experience | 78% |
Aligning recruitment strategies with organizational goals.
Aligning recruitment strategies with organizational goals ensures that every hire contributes to your company’s success. When your hiring process reflects your business objectives, you attract candidates who possess the skills and values needed to drive growth. This alignment also helps you build a workforce that supports innovation, sustainability, and long-term success.
Start by identifying your organization’s key objectives. For example, if your goal is to enhance innovation, focus on sourcing candidates with specialized skills in emerging technologies. Recruitment metrics, such as the effectiveness of sourcing strategies, can help you evaluate how well your efforts align with these goals. Regularly assess these metrics to identify areas for improvement and innovation.
Evidence Type | Description |
|---|---|
Recruitment Metrics | Metrics can assess the effectiveness of sourcing strategies for attracting candidates with specialized skills, supporting organizational goals like innovation and growth. |
Continuous Enhancement | Regular assessment of recruitment strategies against organizational objectives helps identify areas for improvement and innovation. |
Long-term Sustainability | Metrics such as employee retention rates and performance evaluations provide insights into the quality of hires and their alignment with organizational goals. |
Cross-department Collaboration | Effective alignment requires coordination across departments to ensure recruitment efforts meet broader objectives. |
Adaptation to Change | Regular assessment of recruitment strategies against changing organizational goals allows for timely adjustments to recruitment efforts. |
Collaboration across departments is essential. Work closely with team leaders to understand their needs and ensure recruitment efforts align with broader objectives. For instance, if your company prioritizes sustainability, hire candidates who share this vision and can contribute to eco-friendly initiatives.
Adaptability is another critical factor. Organizational goals often evolve due to market changes or new opportunities. Regularly review your recruitment strategies to ensure they remain relevant. Metrics like employee retention rates and performance evaluations provide valuable insights into the quality of your hires and their alignment with your goals.
By aligning recruitment strategies with organizational objectives, you create a hiring process that not only fills positions but also drives your company forward. This approach ensures that every hire adds value and supports your long-term vision.
The Future of Benchmarking in Recruitment

AI and machine learning in recruitment benchmarking.
Artificial intelligence (AI) and machine learning (ML) are transforming recruitment benchmarking. These technologies analyze vast amounts of data to uncover patterns and trends that humans might miss. For example, AI can evaluate candidate profiles to predict their likelihood of success in specific roles. ML algorithms continuously improve by learning from new data, making your benchmarking efforts more accurate over time.
You can also use AI to automate repetitive tasks like resume screening and candidate ranking. This saves time and ensures consistency in evaluating applicants. Additionally, AI-powered tools can identify biases in your hiring process, helping you create a more inclusive recruitment strategy. By integrating AI and ML into your benchmarking, you gain deeper insights and make data-driven decisions with confidence.
Predictive analytics for proactive hiring.
Predictive analytics allows you to anticipate hiring needs and address them before they become challenges. By analyzing historical data, you can identify trends in employee turnover, seasonal hiring demands, and skill gaps. This helps you plan your recruitment efforts more effectively.
For instance, if data shows a high turnover rate in a specific department, you can investigate the root cause and adjust your hiring strategy. Predictive models can also forecast the success of candidates based on their qualifications and past performance. This proactive approach ensures you stay ahead in the competitive job market and maintain a steady talent pipeline.
Real-time benchmarking for agile decision-making.
Real-time benchmarking provides immediate insights into your recruitment process, enabling you to make agile decisions. Dashboards displaying key metrics like pipeline health, source effectiveness, and time-to-hire keep you informed at every stage. Data visualization tools simplify complex information, making it easier for your team to act quickly.
You can also integrate market intelligence to compare your internal data with industry trends. This helps you adjust sourcing strategies on the fly. For example, if a particular job board underperforms, you can reallocate resources to more effective channels. Real-time benchmarking ensures your recruitment process remains flexible and responsive to changing conditions.
Tip: Use real-time analytics to identify bottlenecks and optimize your hiring strategy in real-time. This keeps your recruitment process efficient and competitive.
Diversity and inclusion as key benchmarking metrics.
Diversity and inclusion metrics are essential for creating a fair and equitable workplace. These benchmarks help you measure how well your organization supports individuals from different backgrounds. By tracking these metrics, you can identify areas where your hiring process may unintentionally exclude certain groups and take steps to improve.
One key metric is representation. This measures whether specific groups are over-represented or under-represented in your workforce. Retention rates also provide valuable insights. They show how well your organization retains employees from diverse backgrounds, highlighting potential inclusivity challenges. Recruitment metrics assess the diversity of applicants and the effectiveness of your hiring strategies. Promotion data tracks the demographics of employees who advance within your company, revealing any biases in career growth opportunities. Salary and benefits comparisons ensure equity in compensation across different groups.
Metric | Description |
|---|---|
Representation | Analyzes which groups are over-represented or under-represented in the organization. |
Retention | Evaluates the ability to retain individuals from specific groups, indicating inclusivity issues. |
Recruitment | Assesses the diversity of applicants and the effectiveness of hiring strategies. |
Promotion | Tracks the demographics of promoted employees to identify potential biases in advancement opportunities. |
Salary and Benefits | Compares compensation across different groups to ensure equity in rewards for equal roles. |
Inclusion metrics also help you set measurable goals for diversity and inclusion performance. They provide objective data to identify biases and ensure fairness in your workplace. Monitoring these benchmarks allows you to allocate resources effectively for diversity, equity, and inclusion (DEI) initiatives.
Inclusion metrics track progress toward diversity goals.
They highlight biases and fairness issues in hiring and promotions.
Monitoring these metrics ensures better resource allocation for DEI programs.
By using diversity and inclusion as benchmarking metrics, you create a workplace that values equity and fairness. These efforts not only improve your hiring process but also strengthen your employer brand, making your organization more attractive to top talent.
Benchmarking data plays a vital role in improving hiring efficiency. It provides measurable insights into key metrics like time-to-fill, cost-per-hire, and candidate experience, enabling you to refine your recruitment strategies. For example, industry standards show that a time-to-hire of 24–28 days reflects decision-making efficiency, while a candidate experience NPS of 40–50+ highlights satisfaction during the hiring process.
Metric | Industry Standard | Explanation |
|---|---|---|
Time-to-Fill | 30–45 days | Measures the time from job posting to candidate acceptance. |
Time-to-Hire | 24–28 days | Tracks time from candidate entry to offer acceptance, reflecting decision-making efficiency. |
Cost-per-Hire | £6,125 | Includes all costs associated with hiring, varying by industry and role. |
Offer Acceptance Rate (OAR) | 85–90% (UK average: 69.3%) | Indicates the percentage of candidates accepting offers, highlighting potential issues in the process. |
Candidate Experience NPS | 40–50+ | Gauges candidate satisfaction during the hiring process. |
Adopting data-driven recruitment practices ensures you stay competitive in today’s fast-paced job market. Start leveraging benchmarking tools and strategies to optimize your hiring process and achieve better outcomes. Knowing how to use benchmarking data to optimize your hiring process empowers you to make smarter decisions and build a stronger workforce.
FAQ
What is recruitment benchmarking, and why is it important?
Recruitment benchmarking compares your hiring metrics to industry standards. It helps you identify inefficiencies, set realistic goals, and improve your hiring process. By using benchmarks, you can make data-driven decisions that enhance efficiency and ensure your recruitment strategies align with industry best practices.
How can benchmarking data improve hiring efficiency?
Benchmarking data highlights areas where your hiring process can improve. For example, it shows if your time-to-fill is longer than average or if your cost per hire is too high. By addressing these gaps, you can streamline your process and attract top talent faster.
What tools can help with recruitment benchmarking?
Tools like iCIMS, OneUp, and iMocha are excellent for recruitment benchmarking. They provide features like applicant tracking, data analysis, and skills-based hiring insights. These platforms simplify data collection and comparison, helping you optimize your hiring strategies effectively.
How does candidate experience impact employer branding?
Candidate experience shapes how applicants perceive your company. A positive experience improves your reputation and increases referrals. Research shows 78% of candidates recommend companies after a good hiring process. Clear communication, timely updates, and a smooth application process enhance this experience.
Can benchmarking help with diversity and inclusion?
Yes, benchmarking tracks diversity metrics like representation, retention, and promotion rates. These insights help you identify biases and improve inclusivity. By monitoring these metrics, you can create a fair hiring process and build a diverse workforce that strengthens your organization.
See Also
How AI Recruitment Tools Are Transforming Today's Hiring Methods
Utilizing AI Recruitment Tools to Forecast Candidate Performance
Ten Strategies to Enhance Your Hiring Process with ATS
Leveraging AI for Fair and Impartial Hiring Practices
Improve Your Hiring Choices Using MokaHR's Recruitment Insights
From recruiting candidates to onboarding new team members, MokaHR gives your company everything you need to be great at hiring.
Subscribe for more information