Hiring can no longer be judged by gut feel alone.
In 2026, recruiting managers are expected to defend hiring decisions with data, justify headcount investment, and show how talent outcomes affect the business. Yet many teams still track activity instead of effectiveness.
Gem's 2026 Recruiting Benchmarks Report found that recruiters are managing 93% more applications than they did in 2021, while hires per recruiter have fallen 43%, from 50.5 to 29.0. In other words, recruiting teams are handling more volume, but not necessarily producing more hires.
This makes it more important to look beyond activity and measure what actually improves hiring efficiency and quality.
In this article, we cover the core recruiting metrics every hiring team should track, how they apply across the recruiting funnel, and which metrics matter most for companies at different stages of growth.
What are Recruiting Metrics?
Recruiting metrics are quantitative measurements that describe the efficiency, quality, and outcomes of your hiring process.
Four categories are worth keeping clear from the start.
Efficiency metrics describe how fast and cost-effectively your hiring process runs. Common examples include time to hire, time to fill, cost per hire, and time per stage.
Quality metrics describe whether the hires you make actually work out. These include quality of hire, first-year retention, hiring manager satisfaction, candidate job fit, and time to productivity.
Funnel and conversion metrics describe how candidates move through your pipeline. These include applications per role, screening pass-through rate, interview-to-offer ratio, offer acceptance rate, and conversion rate by stage.
Pipeline metrics measure whether your team is building future hiring capacity, not just reacting to today's open roles.
Recruiting Metrics Checklist
Use this as a quarterly review template. If you can fill in a number and a trend for each row, your measurement layer is in good shape.
| Metric | Category | What it answers |
|---|---|---|
| Time to Hire | Efficiency | How fast does our process move once a candidate applies? |
| Time to Fill | Efficiency | How long does a req stay open? |
| Time per Stage | Efficiency | Where in the funnel are we slow? |
| Cost per Hire | Efficiency | What does each hire cost us all-in? |
| Cost per Channel | Efficiency | Which channels are worth the spend? |
| Hires per Recruiter | Efficiency | How much hiring capacity does each recruiter support? |
| Quality of Hire | Quality | Are our hires performing and staying? |
| First-Year Attrition Rate | Quality | Are we losing new hires too fast? |
| Hiring Manager Satisfaction | Quality | Is recruiting delivering what the business needs? |
| Candidate NPS | Quality | How do candidates experience us? |
| Applicants per Role | Funnel | Is the top of our funnel healthy? |
| Application Completion Rate | Funnel | Is our apply flow too long? |
| Screening Pass-Through Rate | Funnel | Is our targeting attracting the right people? |
| Conversion Rate by Stage | Funnel | Where exactly are candidates dropping off? |
| Interview-to-Offer Ratio | Funnel | Are extra interviews adding signal? |
| Offer Acceptance Rate | Funnel | Are our offers competitive? |
| Qualified Candidates per Role | Funnel | How many applicants meet the basic requirements for a role |
| Source of Hire | Funnel | Where do our best hires come from? |
| Talent Pool Growth | Pipeline | Are we investing in future hires? |
| Positive Response Rate | Pipeline | How many sourced candidates respond with genuine interest? |
Core Recruiting Metrics to Track
This section introduces 20 recruiting metrics worth tracking, including what each metric means, how to calculate it, and how teams can use it in practice.
Efficiency metrics
1.Time to Hire
It measures the number of days between a candidate entering your hiring process and accepting an offer.
Time to hire = offer acceptance date - application date
This metric reflects the candidate-side experience of your hiring process. If time to hire is too long, qualified candidates may lose interest, accept another offer, or assume the company is disorganized.
How to interpret it:
-
If time to hire is rising, check where candidates are stuck.
-
If time to hire is high but time to fill is normal, the issue may be interview coordination or decision speed.
-
If both time to hire and time to fill are high, the problem may start earlier, such as slow requisition approval, weak sourcing, or role-market mismatch.
2.Time to Fill
Time to fill measures the number of days between a requisition opening and the role being filled.
Time to fill = offer acceptance date - requisition open date
Unlike time to hire, time to fill includes the period before the first candidate enters the process. That makes it useful for understanding the full operational timeline of a role.
A long time to fill is not always a recruiting failure. Some roles are genuinely hard to hire for because of location, compensation, seniority, or scarce skill sets. The key is to separate avoidable internal delays from real market difficulty.
3.Time per Stage
Time per stage measures how long candidates spend in each step of the hiring funnel. It shows exactly where candidates are stuck, if your time to hire is creeping up, time per stage tells you why.
Example stages include:
-
Applied
-
Recruiter screen
-
Hiring manager review
-
First interview
-
Panel interview
-
Assessment
-
Offer approval
-
Offer extended
If candidates spend two days in recruiter review but twelve days waiting for hiring manager feedback, the solution is not "source more candidates." The solution is to fix feedback discipline, interview availability, or stakeholder ownership. Time per stage turns a vague complaint like “hiring is slow” into a specific operational problem.
4.Cost per Hire
Cost per hire measures the total recruiting cost required to make one hire.
Cost per hire = total recruiting costs / number of hires
Costs may include:
-
Job board fees
-
Agency fees
-
Recruitment advertising
-
Recruiter compensation allocated to hiring activity
-
Assessment tools
-
Referral bonuses
-
Employer branding campaigns
-
Recruiting software
-
Background checks
Cost per hire becomes much more useful when paired with quality of hire and retention. A low-cost source is not efficient if it produces poor-fit hires.
5.Cost per Channel
Cost per channel breaks recruiting spend down by sourcing channel. This metric helps teams understand which channels are generating applications, qualified candidates, interviews, offers, and hires.
Common channels include job boards, LinkedIn, referrals, agencies, career sites, university recruiting, and recruitment marketing campaigns.
A common mistake is measuring cost per applicant instead of cost per qualified candidate or cost per hire. A cheap channel that generates unqualified volume can create more recruiter workload, not more hiring efficiency.
6.Hires per Recruiter
Hires per recruiter measures how many hires each recruiter completes within a given period.
Hires per recruiter = Total hires ÷ Number of recruiters
This metric helps teams understand whether recruiting capacity is sufficient, how much hiring volume each recruiter can support, and whether the team needs additional headcount or more automation.
For highvolume hiring, hires per recruiter is especially important because it shows whether recruiters can manage large candidate pools and recurring hiring demands efficiently.
Quality Metrics
7.Quality of Hire
Quality of hire is one of the most strategically important recruiting metrics, but it is also one of the hardest to measure cleanly.
A practical model combines several signals: Quality of hire = performance + retention + hiring manager satisfaction + ramp speed. The exact formula matters less than consistency.
Common inputs include:
-
90-day hiring manager satisfaction
-
6–12 month performance rating
-
First-year retention
-
Time to productivity
-
Goal attainment
-
Culture or team fit
-
Promotion or internal mobility over time
8.First-Year Attrition Rate
It measures the percentage of new hires who leave within their first twelve months.
A spike here usually points to one of three issues: a job preview that misrepresented the role, an onboarding gap, or a screening process selected for the wrong traits. This metric matters because hiring does not end when an offer is accepted. If a team fills roles quickly but loses new hires within months, the hiring process is not truly effective.
9.Hiring Manager Satisfaction
It measures whether hiring managers are satisfied with the quality, fit, and readiness of candidates presented by the recruiting team. This is usually collected through a short survey after hire.
Questions may include:
-
Were the candidates aligned with the role requirements?
-
Was the shortlist strong enough?
-
Did the recruiter understand the hiring need?
-
Was communication clear and timely?
-
Would you work with this recruiter or hiring process again?
This metric is a leading indicator of alignment. Low hiring manager satisfaction often means the recruiter and hiring team are not aligned on what “qualified” actually means.
10.Candidate Net Promoter Score (cNPS)
Candidate Net Promoter Score, or cNPS, measures how likely candidates are to recommend your company as a place to apply or interview. It is useful because rejected candidates also shape your employer brand. A candidate who is rejected respectfully may still apply again, refer someone else, or speak positively about the company.
cNPS = % promoters - % detractors
Candidates are usually asked a question such as: Based on your experience, how likely are you to recommend applying to our company?
Responses are grouped as:
-
Promoters: 9–10
-
Passives: 7–8
-
Detractors: 0–6
Funnel and Conversion Metrics
11.Applicants per Role
Applicants per role measures the number of applications received for each open position. This is a top-of-funnel signal, but it needs interpretation. A role with five applicants in two weeks may have a sourcing or employer brand problem. A role with 500 applicants and very few qualified candidates may have a targeting problem.
12.Application Completion Rate
Application completion rate measures the percentage of candidates who start an application and actually submit it. A low completion rate usually signals friction in the application process. This metric is especially important for high-volume and frontline hiring, where candidates often apply from mobile devices and may abandon slow or repetitive forms.
13.Screening Pass-Through Rate
It measures the percentage of applicants who pass the initial screen.
Screening pass-through rate = candidates passed screen / total applicants screened
A very low pass-through rate may mean:
-
Job ads are attracting the wrong candidates.
-
Requirements are unclear.
-
The role is posted too broadly.
-
Screening criteria are too strict.
-
The compensation or location is misaligned with the market.
14.Conversion Rate by Stage
Conversion rate by stage measures the percentage of candidates who move from one step of the funnel to the next. This is one of the most diagnostic recruiting metrics because it shows exactly where candidates drop off.
Screen to interview conversion = candidates invited to interview / candidates screened. >
Screening pass-through rate focuses specifically on the initial screening stage, while conversion rate by stage tracks movement between any two steps in the recruiting funnel. Together, they help teams understand both screening quality and overall funnel health.
15.Interview-to-Offer Ratio
It measures how many interviewed candidates are needed to generate one offer.
Interview-to-offer ratio = interviewed candidates / offers extended
A high ratio may suggest that too many underqualified candidates are reaching interviews, or that hiring teams are not aligned on what they want. It may also indicate that the interview process is generating noise rather than signal. More interviews do not always mean better selection. If extra rounds do not improve decision quality, they may simply slow down hiring and hurt candidate experience.
16. Offer Acceptance Rate
Offer acceptance rate measures the percentage of extended offers that candidates accept.
Offer acceptance rate = accepted offers / extended offers
Offer acceptance should be tracked by department, recruiter, role type, source, and hiring manager. If one team consistently loses candidates at offer stage, the problem is unlikely to be random.
17.Source of Hire
Source of hire attributes each hire to the channel that first brought the candidate into the recruiting process. It is a key metric for recruiting ROI because it helps teams decide where to invest their time and budget.
However, source data is often difficult to track accurately. Candidates may interact with multiple touchpoints before applying, such as a LinkedIn post, the career site, and a job board.
To improve accuracy, teams should start with clear attribution rules instead of relying only on manual entry. It also helps separate source of applicant from source of hire and track both the original source and the latest source where possible.
18.Qualified Candidates per Role
Qualified candidates per role measures how many applicants meet the basic requirements for a role and are worth moving forward in the hiring process.
Qualified candidates per role = qualified candidates ÷ open roles
It is especially useful for high-volume hiring teams and SMBs because it helps recruiters avoid mistaking application volume for hiring progress. A healthy funnel is not just one with many applicants, but one that consistently produces candidates who are qualified enough to move forward.
Pipeline and Sourcing Metrics
19.Talent Pool Growth
Talent pool growth tracks the number of qualified candidates added to your CRM or talent database over time.
This is especially important for recurring roles, hard-to-fill roles, and strategic workforce planning.
A flat talent pool may indicate that sourcing is too reactive. A growing talent pool, on the other hand, gives recruiters more leverage when a role opens.
20.Positive Response Rate
Positive response rate measures the percentage of sourced candidates who respond with interest.
Positive response rate = interested responses / outreach messages sent
Reply rate shows whether candidates respond, while positive response rate shows whether they respond with interest. For most teams, positive response rate is the stronger sourcing metric because it filters out neutral or negative replies.
For example, a sourcing campaign may have a high reply rate but low positive response rate if many candidates are saying "not interested." That suggests the message is generating attention but not fit.
The Recruiting Funnel: Which Metric Matters at Each Stage?
Recruiting metrics are most useful when they are viewed through the full recruiting funnel. Each stage reveals a different bottleneck, and each requires a different set of metrics to evaluate performance.
In this section, we'll look at the key metrics that matter at each stage of the recruiting funnel and explain how teams can use them to improve efficiency, identify drop-offs, and make better hiring decisions.
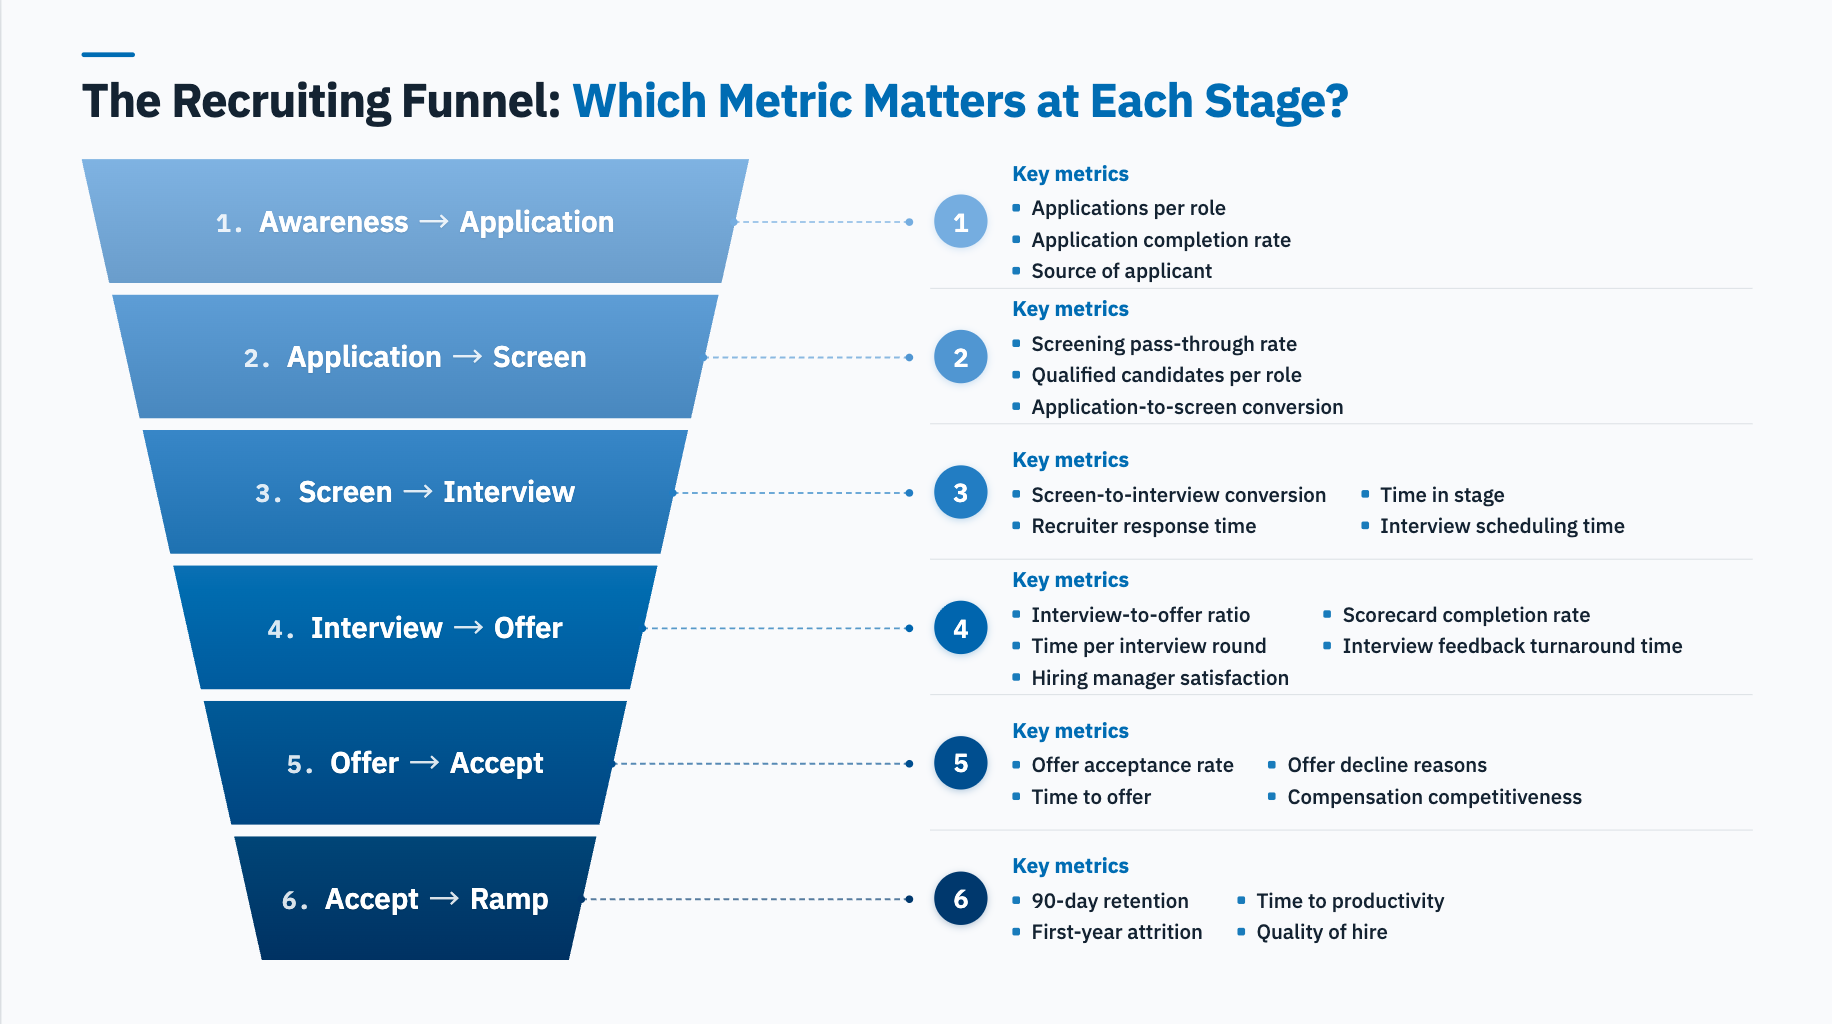
Stage 1: Awareness → Application
Main question: Are we reaching the right candidates, and is it easy enough for them to apply?
If traffic is high but applications are low, the issue may be job description quality, application friction, weak employer brand, or unclear compensation/location information.
Key metrics:
-
Applications per role
-
Application completion rate
-
Source of applicant
Stage 2: Application → Screen
Main question: Are we attracting qualified candidates, and are we filtering efficiently?
This stage often reveals one of two problems: either the role is attracting the wrong candidates, or the screening criteria are not accurate enough. If too many applicants are rejected during screening, the issue may not be recruiter speed. It may be that the candidate profile is not aligned with the hiring manager, the job description is too broad, the job title is misleading, the sourcing channel is not precise, or the requirements are set too low.
For example, if a role receives 500 applications but only 10 candidates are qualified, the team should review whether the job description, compensation range, experience requirements, and source strategy are attracting the right audience. On the other hand, if too many candidates pass screening but later fail interviews, the screening criteria may be too loose or not closely aligned with what the role actually requires.
Key metrics:
-
Screening pass-through rate
-
Qualified candidates per role
-
Application-to-screen conversion
Stage 3: Screen → Interview
Main question: Are we losing qualified candidates because of slow coordination or weak engagement?
At this stage, the focus shifts from candidate quality to process speed. Candidates who pass screening already show basic fit, so delays in scheduling, follow-up, or communication may lead to drop-off.
This is especially true for competitive roles. When qualified candidates are not moved forward quickly, teams risk losing them to other opportunities. That makes screen-to-interview conversion, response time, and scheduling speed key indicators of recruiting efficiency.
Key metrics:
-
Screen-to-interview conversion rate
-
Recruiter response time
-
Time per stage
-
Interview scheduling time
Stage 4: Interview → Offer
Main question: Are interviews generating useful signal?
This stage measures interview quality and decision efficiency. More interviews do not always lead to better hiring decisions. If many candidates reach interviews but few receive offers, the team should review where the process is breaking down. The problem may come from weak screening, poor interview design, inconsistent evaluation standards, unclear hiring manager expectations, or slow feedback.
Key metrics:
-
Interview-to-offer ratio
-
Time per interview round
-
Hiring manager satisfaction
-
Interview feedback turnaround time
Stage 5: Offer → Accept
Main question: Are our offers competitive, and is the candidate already sold before the offer is extended?
This stage measures whether candidates are ready to choose your company. A strong close starts before the offer is sent. Recruiters and hiring managers should understand the candidate’s motivation, competing opportunities, compensation expectations, and decision timeline early in the process.
Offer acceptance rate is a key outcome metric. If many offers are extended but few are accepted, the issue may come from compensation, slow decision-making, weak role positioning, or a lack of alignment with the candidate’s expectations. Candidates may also decline when they do not fully understand the value of the role, the company, or the growth opportunity.
Key metrics:
-
Time to offer
-
Offer acceptance rate
-
Offer decline reasons
-
Compensation competitiveness
Stage 6: Accept → Ramp
Main question: Did we hire the right person, and did the onboarding process set them up to succeed?
Recruiting metrics should not stop at offer acceptance. The real business outcome comes after the hire: whether candidates start, stay, ramp up, and perform. If a source brings in many candidates but many hires leave within 90 days, source quality or screening criteria may need review. If time to productivity is consistently long for certain roles, the issue may be role fit, hiring criteria, onboarding quality, or manager support.
Key metrics:
-
90-day retention
-
First-year attrition
-
Time to productivity
-
Quality of hire
Which Recruiting Metrics Should Your Team Prioritize?
Not every team needs to track every recruiting metric with the same level of detail. The right metrics depend on hiring volume, company stage, recruiting maturity, and business goals.
A small team may need a simple view of speed and hiring outcomes, while an enterprise team may need deeper segmentation by business unit, location, recruiter, and hiring manager. Either way, an ATS with built-in analytics like Moka AI can make reporting easier by automatically tracking data in one place.
| Team Type | Priority Metrics | Why These Metrics Matter |
|---|---|---|
| Small Teams and SMBs | Time to hire Time to fill Source of hire Qualified candidates per role Application-to-interview conversion rate Offer acceptance rate Cost per hire | Small teams and SMBs should focus on basic efficiency, hiring outcomes, and source effectiveness, with the goal of getting the most value from limited recruiting resources. |
| High-Volume Hiring Teams | Applicants per role Application completion rate Screening pass-through rate Qualified candidates per role Time per stage Interview scheduling time Interview show-up rate Offer acceptance rate Cost per hire Hires per recruiter | High-volume hiring teams should focus on metrics that show how efficiently candidates move through the process at scale. Their core challenge is identifying qualified candidates quickly from a large applicant pool while keeping the hiring process stable and consistent. |
| Scaling Companies | Quality of hire Pipeline coverage Source quality Interview-to-offer ratio Hiring manager satisfaction First-year attrition Recruiter workload | They need to know whether their hiring process can grow with the business without lowering candidate quality or overwhelming recruiters. |
| Enterprise Teams | Time per stage Stage conversion rate by business unit Source effectiveness Recruiter workload Hiring manager response time Interview completion rate Offer acceptance rate Compliance completion Quality of hire by business unit | Enterprise recruiting teams need metrics that help ensure hiring processes stay consistent, manageable, compliant, and repeatable across departments, locations, recruiters, and hiring managers. |
2026 Recruiting Benchmarks: What to Take Away
Benchmarks are most useful when they help teams understand whether their hiring process is becoming faster, more consistent, and more scalable. They should be treated as context rather than universal targets. They give teams a reference point for finding gaps in their own recruiting process. To better understand how recruiting performance is changing, let’s look at a few key insights from recent reports.
Recent data shows that hiring teams increasingly need better process optimization, not just more applicants. Gem's 2026 Recruiting Benchmarks Report, based on 165 million applications and 1.2 million hires, found that only 0.5% of applicants are ultimately hired, while offer acceptance reached 82%, the highest level since 2021. This suggests that application volume alone is not a reliable measure of recruiting success. Many teams are not short on resumes; the harder challenge is identifying the right candidates quickly and consistently from a large applicant pool.
For scaling companies, this means improving quality before increasing volume: better source quality, clearer job descriptions, and more precise screening criteria. For high-volume hiring teams, the same challenge becomes a scale problem. As applicant pools grow, even small inefficiencies in screening or workflow design can overwhelm recruiters, making standardization and automation essential.
Recruiting coordination remains another major bottleneck. Modern hiring is coordination-heavy. Tellent found that the global average time to hire is 40.1 days, while larger companies average around 28 days in 2025. The same report also points to an average of 5.5 interviews per hire, showing how much coordination is involved in moving candidates through the process. For high-volume teams, even small reductions in time per stage can create meaningful gains.
For more benchmark data, you can refer to and download the original reports from Gem and Tellent. We'll continue to share more analysis and practical takeaways in future updates.
FAQ
Which recruiting metrics should a small TA team or SMB hiring team start with?
Start with five: time to hire, conversion rate by stage, offer acceptance rate, qualified candidates per role, and cost per hire. These five give you visibility into speed, funnel health, and efficiency without overwhelming a small team. Add quality of hire and first-year retention once you have 6–12 months of baseline data.
What is the difference between time to hire and time to fill?
Time to hire measures from candidate application to offer acceptance. Time to fill measures from requisition open to offer acceptance (or start date) and it is the business-impact timeline. Time to hire reveals process bottlenecks; time to fill reveals sourcing and approval bottlenecks.
How to build a talent pipeline, and which metrics show whether it is working?
Talent pipeline development is the practice of nurturing candidates before you have an open role for them through outbound sourcing, talent communities, events, and silver-medalist nurture. If you are asking how to build a talent pipeline from scratch, start by tagging past silver-medalist candidates in your ATS, set up nurture sequences for high-priority role families, and assign weekly sourcing targets per recruiter. The metrics that prove pipeline management is working are talent pool growth, sourced-hire share, rediscovered-hire rate, and time to fill for sourced roles (which should be meaningfully shorter than for purely inbound roles).
Which recruitment analytics software is right for us?
The right choice is usually an ATS with strong native analytics built in, so that funnel, source, and time-in-stage data is available without a separate reporting stack. For enterprise teams with multiple ATS instances or a need to combine recruiting data with HRIS, performance, and finance data, a dedicated HR analytics software or talent analytics tool layered on top makes sense. The decision driver is integration overhead, not feature count.
How often should we review recruiting metrics?
Weekly for funnel health (where are candidates stuck right now), monthly for efficiency metrics (time to hire, cost per hire, source mix), quarterly for quality metrics (quality of hire, retention, hiring manager satisfaction). Anything more frequent than that becomes noise; anything less frequent and the trend lags reality.
Final Thoughts
Recruiting metrics are not about measuring recruiters for the sake of measurement. They are about making better hiring decisions.
The best teams do not use metrics to create pressure. They use them to create clarity. They know where candidates drop off, which sources produce quality hires, which hiring managers need support, and which process changes will improve outcomes.
In 2026, recruiting teams are expected to do more with leaner teams, tighter budgets, and higher expectations. The teams that perform best will not simply collect more data. They will build a hiring process where every metric points to a decision, every bottleneck has an owner, and every hire can be connected back to the quality of the process that produced it.


