Why Your Hiring Cycle Keeps Stretching — And a Framework to Find Your Real Bottleneck
Here is a fact that should disturb every Head of TA: the global average time-to-hire has risen from 31 days in 2023 to 44 days in 2025 (EasyApply benchmark data, October 2025). Professional services firms now average 47 days. Energy and defense roles push past 67. Even tech, the most digitally-mature sector, sits at 45 days.
The interesting part is not that hiring is slower everywhere. The interesting part is that the variance between teams in the same industry is now larger than the variance between industries. Two tech companies hiring the same role in the same market can deliver offers 30 days apart, and neither is "doing recruiting wrong" by any obvious standard.
The difference is almost always one specific stage in the pipeline — and most teams can't see which one.
This piece introduces a simple framework for diagnosing where your own time-to-hire is being lost. It comes with industry benchmarks, four common failure patterns we see across Moka's customer base, and a 21-day pipeline scorecard you can start using next Monday.
The headline is straightforward: aggregate time-to-hire metrics lie to you. Audit your seven stages individually, and the bottleneck becomes obvious — usually within an afternoon.
The story of a 47-day hire that should have been 21 days
Let's start concrete. A mid-sized financial services firm in Singapore — 800 employees, hiring 12 senior analysts per year — is averaging 47 days from job posting to offer acceptance. The Head of TA has been telling the board it's "just the market." The CEO is starting to ask harder questions.
A pipeline audit reveals the actual breakdown:
- JD posting → first qualified applicant: 3 days (industry benchmark: 2–4 days) ✓
- Application → recruiter screen: 12 days (industry benchmark: 3–5 days) ✗
- Recruiter screen → first interview: 5 days (industry benchmark: 5–7 days) ✓
- First interview → panel interview: 11 days (industry benchmark: 5–7 days) ✗
- Panel → final decision: 8 days (industry benchmark: 3–5 days) ✗
- Decision → offer extended: 2 days (industry benchmark: 1–2 days) ✓
- Offer extended → acceptance: 6 days (industry benchmark: 5–7 days) ✓
Three of seven stages are out of band. Two of them (recruiter screening and panel scheduling) are pure logistics problems — both highly automatable. The third (final decision latency) is a hiring manager problem that no software can fix until you name it.
The cost of those 26 excess days, by the way, isn't abstract. A $120K analyst role left open for an extra month costs roughly $22K in lost productivity (using the standard 20% of annual salary heuristic), plus the harder-to-quantify cost of two top candidates who got faster offers from competitors during the wait. Across 12 hires per year, that's somewhere north of $300K annually — for a problem solvable with maybe four weeks of process work.
This is what happens when teams optimise the aggregate number ("get time-to-hire under 40") instead of auditing the underlying stages.
Why aggregate time-to-hire metrics lie to you
Every recruiting team tracks time-to-hire. Most use it wrong.
The number is an average across hires, which means it masks the fact that the same team often has two completely different recruiting processes running in parallel — a fast one for some roles and a stuck one for others. When you report a single 44-day average, the CEO can't tell whether you have:
- Pattern A: Every hire takes around 44 days (a uniform process problem, fixable with workflow automation)
- Pattern B: Half your hires close in 28 days and half take 60+ (a triage problem, where some types of roles need a fundamentally different playbook)
- Pattern C: Most hires close in 32 days but you have 2–3 "stuck reqs" each quarter that drag the average up by 12+ days (a structural issue with specific role types or specific hiring managers)
Each pattern requires different interventions. None of them is visible in the aggregate number.
The second problem with aggregate time-to-hire is that it tells you "how long" but never "where". A 44-day hire could be 40 days waiting and 4 days of activity, or 30 days of activity and 14 days of waiting. Those are completely different problems. The first wants automation; the second wants better screening criteria upstream.
This is why audit beats benchmarking. The benchmark says you're slow. The audit tells you which 5 days to attack.
The 7-stage pipeline audit framework
Below is the framework we use with Moka customers when their CHRO asks "why does this take so long?" It splits the hiring funnel into seven stages, each with industry-benchmark ranges drawn from the most recent public sources and Moka's internal aggregate data.
**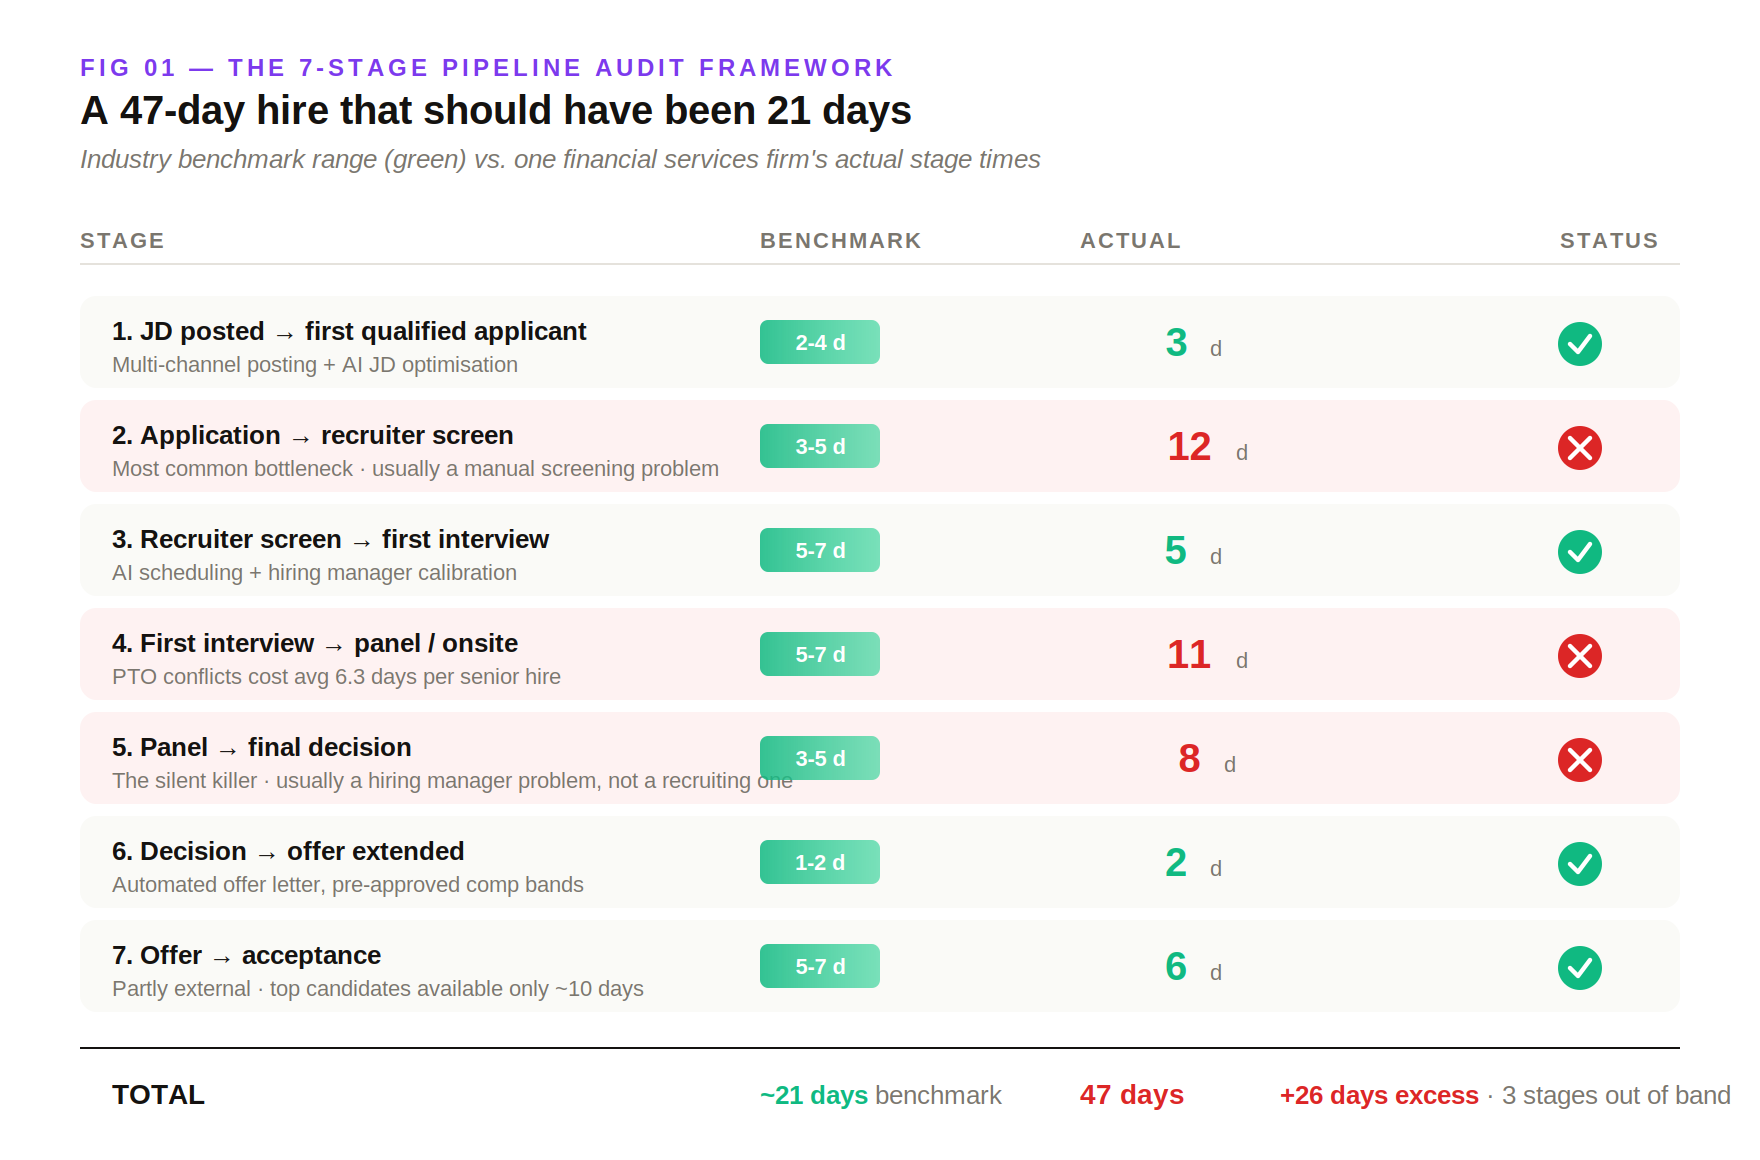 — 7-stage pipeline benchmark heatmap
Fig 1. The 7-stage pipeline audit framework with industry benchmarks. Sources: EasyApply 2025, Genius hiring data, SHRM benchmarks, Moka customer adoption data.
Stage 1 — JD posting to first qualified applicant
Industry benchmark: 2–4 days
What it measures: how long it takes for your job posting to attract applicants who actually match the JD on its face.
What "broken" looks like: more than 7 days. Usually a JD problem (too long, too narrow, jargon-heavy), a channel problem (posting only on your careers page, not the major job boards), or a market problem (too narrow a candidate pool for the requirement).
What fixes it: AI JD optimisation tools that benchmark your posting against high-performing comparable JDs. Multi-channel posting automation. Realistic requirement scoping with the hiring manager.
Stage 2 — Application to recruiter screen
Industry benchmark: 3–5 days
What it measures: how long applicants wait after submitting before a recruiter actually talks to them.
What "broken" looks like: 7+ days, sometimes 14+. This is the most common bottleneck we see, and it is almost always caused by manual resume screening burying recruiters in volume they can't keep up with.
What fixes it: AI resume screening that handles the high-volume sorting overnight, letting recruiters focus on the top 15–20% of qualified applicants the next morning. This single intervention often compresses a stage from 12 days to 3 days.
Stage 3 — Recruiter screen to first interview
Industry benchmark: 5–7 days
What it measures: how long after a positive screening call before the candidate gets in front of the hiring manager.
What "broken" looks like: 10+ days. Usually a scheduling problem — calendar tetris between candidate availability and hiring manager availability — or a calibration problem where the recruiter and hiring manager haven't aligned on what makes someone worth interviewing.
What fixes it: AI scheduling automation that handles multi-calendar coordination. Pre-screen calibration meetings with hiring managers. Pre-loaded interview question templates so the manager can take the meeting on short notice.
Stage 4 — First interview to panel/onsite
Industry benchmark: 5–7 days
What it measures: how long between the first interview pass and the larger panel or onsite stage.
What "broken" looks like: 10+ days, especially with the dreaded "we need to wait until everyone is back from PTO" pattern. Research shows that one interviewer on PTO costs an average of 6.3 days per senior hire (InterviewPal 2025 data) — and many teams just accept this as inevitable.
What fixes it: Pre-defined panel rosters with backups. Asynchronous interview options (recorded video, take-home exercises) for steps that don't strictly need real-time. AI scheduling that flags PTO conflicts before they happen.
Stage 5 — Panel/onsite to final decision
Industry benchmark: 3–5 days
What it measures: how long after the final interview before a hire/no-hire decision is made.
What "broken" looks like: 7+ days. This is the silent killer — and it is almost never a recruiting problem. It is a hiring manager problem. The interviewers either haven't submitted feedback (no deadline enforcement) or have submitted contradictory feedback that no one is resolving.
What fixes it: A 48-hour SLA on interviewer feedback, automated reminders, and a structured debrief process. Software can prompt; only leadership can enforce.
Stage 6 — Decision to offer extended
Industry benchmark: 1–2 days
What it measures: how long after the hire decision before the candidate has an actual offer in hand.
What "broken" looks like: 5+ days. Usually a process problem: offer letters being manually assembled, approval chains involving multiple senior people, legal review queues without SLAs.
What fixes it: Automated offer letter generation pulling from the candidate record. Pre-approved compensation bands so most offers don't need senior approval. Parallel rather than serial approval routing.
Stage 7 — Offer extended to acceptance
Industry benchmark: 5–7 days
What it measures: how long between offer extension and the candidate signing.
What "broken" looks like: 10+ days, or worse, declines. This stage is partly outside your control — candidates have other processes running — but signal-loss here usually means competing offers, weak final close, or unaddressed concerns the candidate had during the panel.
What fixes it: Predictive offer-acceptance scoring (the Candidate Digital Twin layer 2 work) that tells you which offers need stronger closes before they go out. Faster decision cycles upstream so candidates don't have time to interview elsewhere.
The diagnostic: where is your bottleneck?
Run your last 10 closed hires through the 7-stage framework. Compare each stage average to the benchmark range above. The stage where you're most out of band — by absolute days, not percentage — is your bottleneck.
In Moka's customer base, the bottleneck distribution looks roughly like this:
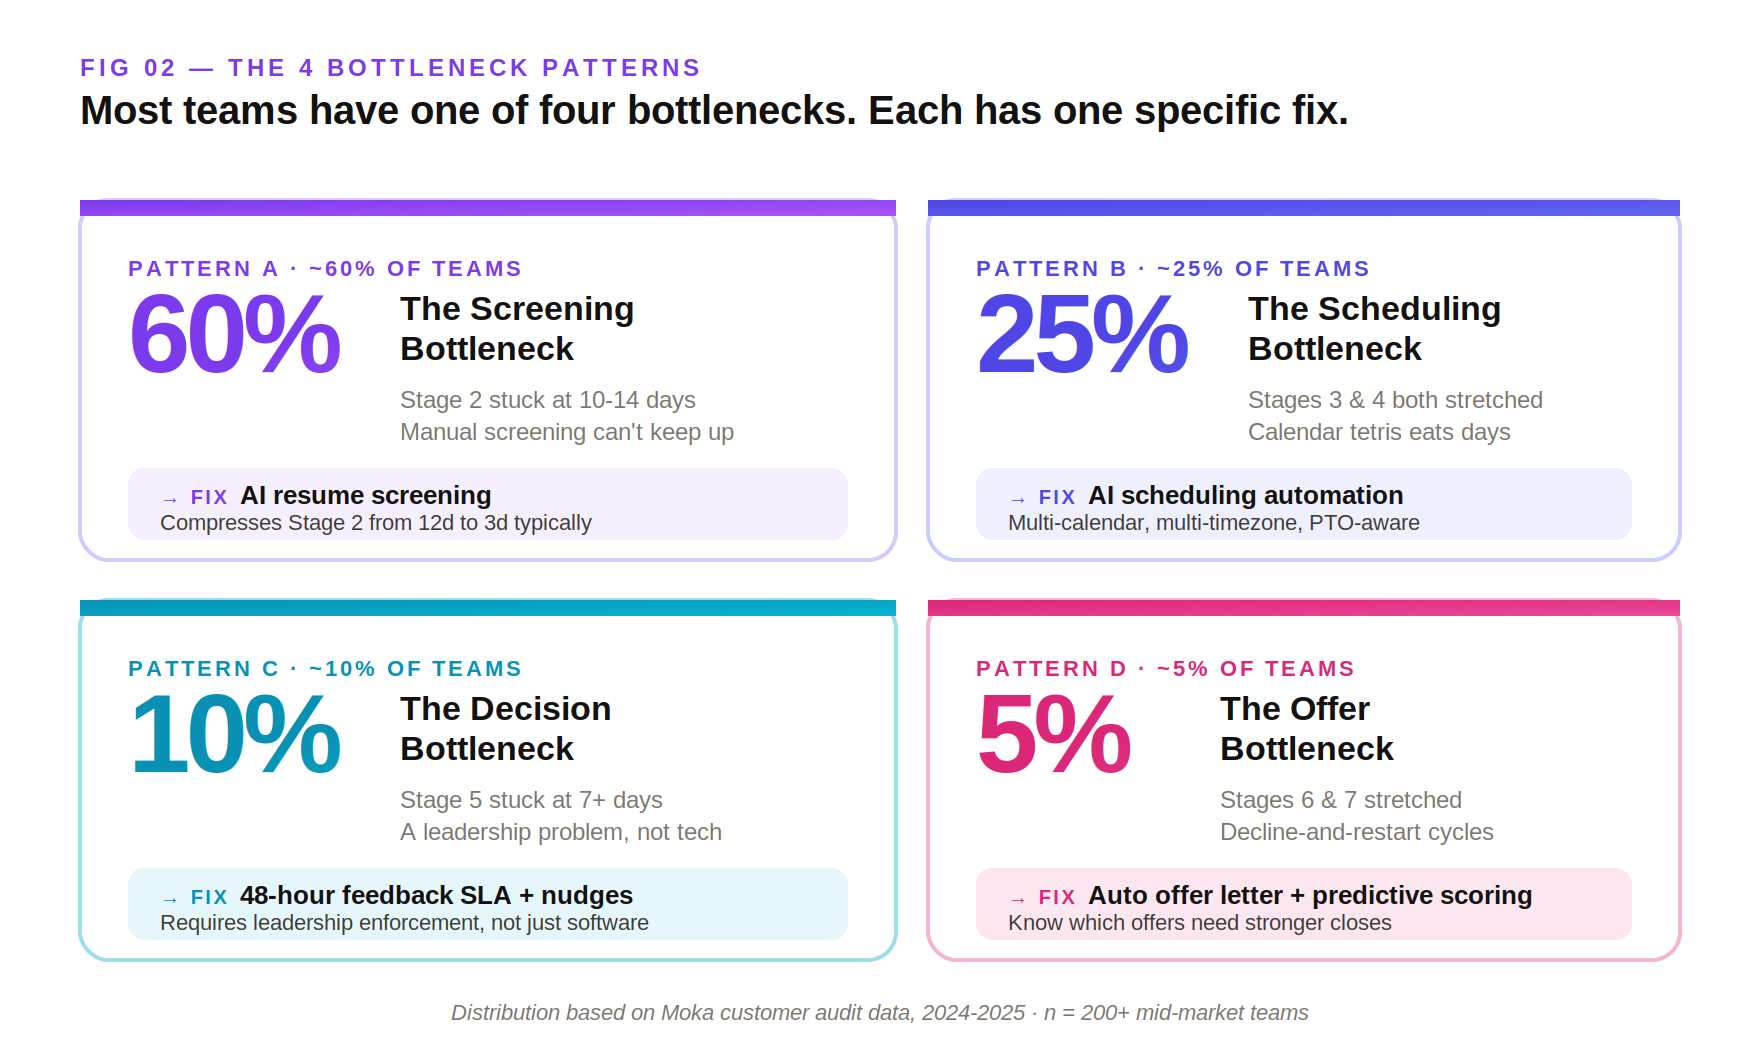 — bottleneck distribution + fix mapping
Fig 2. The four most common pipeline bottleneck patterns in mid-market recruiting teams, and the specific intervention that addresses each. Source: Moka customer audit data, 2024–2025.
Bottleneck pattern A — The Screening Bottleneck (≈ 60% of teams)
Stage 2 (Application → Recruiter Screen) is the dominant problem. Recruiters can't keep up with volume. Resumes pile up. Qualified candidates take other offers before anyone calls them.
The intervention: AI resume screening. This is the single highest-ROI fix in recruiting operations, full stop. A 12-day stage routinely compresses to 3 days with proper deployment, and the recruiter-to-req ratio simultaneously improves.
Bottleneck pattern B — The Scheduling Bottleneck (≈ 25% of teams)
Stages 3 and 4 (Screen → Interview, Interview → Panel) are both stretched. Calendar coordination eats days. Multiple time zones make it worse. Senior interviewers' calendars are impossible to find space in.
The intervention: AI scheduling automation. Less glamorous than resume screening, but actually a comparable productivity gain — and a much better candidate experience improvement. Candidates interpret fast scheduling as a signal of organisational quality.
Bottleneck pattern C — The Decision Bottleneck (≈ 10% of teams)
Stage 5 (Panel → Decision) is stuck. Interviewers don't submit feedback on time. Hiring managers can't decide. Conflicting opinions don't get resolved.
The intervention: Process discipline more than software. A 48-hour feedback SLA, structured debrief meetings, decision authority clarified up front. The supporting software is interviewer feedback automation (templated forms, automated nudges, dashboards visible to the Head of TA).
This bottleneck is harder to fix than the first two because it requires leadership change, not just tool deployment.
Bottleneck pattern D — The Offer Bottleneck (≈ 5% of teams)
Stages 6 and 7 (Decision → Offer, Offer → Acceptance) are stretched. Slow offer assembly, slow legal review, low offer-acceptance rates that trigger restarts.
The intervention: Automated offer letter generation, pre-approved comp bands, and predictive offer-acceptance modelling so the team knows in advance which offers need stronger closes.
The trap of fixing the wrong stage
Most teams default to fixing whatever they last read an article about. That's almost always the screening bottleneck — because everyone writes about resume screening — even when their actual problem is decision latency. Run the audit before you buy the tool.
Where most teams get this audit wrong
Three pitfalls we see most often.
Pitfall 1 — Measuring only successful hires
If you only audit the candidates who eventually got hired, you systematically miss the candidates who dropped out at each stage. A stage with a 3-day median for completed hires might have a 9-day median for candidates who dropped out — because they got frustrated and took other offers during the wait.
Always audit dropouts alongside completes. The dropout pattern usually points to the real bottleneck faster than the completion pattern.
Pitfall 2 — Treating role types as one population
Senior hires take longer than entry-level. Technical roles take longer than non-technical. Cross-border hires take longer than local. Mixing these in a single average obscures everything.
The minimum useful segmentation is: by role level (IC vs Manager vs Director+), by function (Tech vs Sales vs G&A), and by location complexity (local vs cross-border). Run the 7-stage audit within each segment.
Pitfall 3 — Conflating time-to-hire and time-to-fill
These are different metrics. Time-to-hire measures the candidate journey: application to acceptance. Time-to-fill measures the business need: req opened to candidate starts. The gap between them — usually 1 to 4 weeks — is the candidate's notice period plus your onboarding lead time.
If your bottleneck is in time-to-fill but not in time-to-hire, no amount of recruiting automation will help. The problem is upstream (req approval slowness, slow JD finalisation) or downstream (onboarding readiness).
The 21-day pipeline scorecard
Here is a target benchmark to anchor your audit against — what a well-functioning mid-market pipeline looks like at the upper bound of "fast but realistic." This is not 12-day construction-industry hiring; this is a senior knowledge-worker hire done with appropriate care.
| Stage | Target | What "well-run" looks like |
|---|---|---|
| 1. JD → first qualified applicant | 2 days | Multi-channel auto-posting, AI-optimised JD, realistic scope |
| 2. Application → recruiter screen | 3 days | AI screening overnight, recruiter reviews top 15% next morning |
| 3. Recruiter screen → first interview | 4 days | AI scheduling, pre-aligned hiring manager calibration |
| 4. First interview → panel | 5 days | Pre-defined panel roster, PTO conflict flagging in advance |
| 5. Panel → final decision | 3 days | 48-hour feedback SLA, structured debrief |
| 6. Decision → offer extended | 1 day | Automated offer letter, pre-approved comp band |
| 7. Offer → acceptance | 3 days | Predictive offer scoring, strong close calls scheduled in advance |
| Total | 21 days | The realistic upper bound for excellent execution |
If your audit shows 30 days, you have one or two clear bottlenecks. If it shows 44+ days, you have three or more stages out of band, and the pattern is usually compound — fixing only one won't drop you to benchmark.
The good news: in almost every team we've seen, getting from 44 to 28 days is mostly a Stage 2 + Stage 3 + Stage 5 problem, and the first two of those are highly automatable.
How to start measuring next Monday
If you've read this far, you probably want to actually do the audit. Here is the minimum-effort version that works.
Step 1 — Pull your last 10 closed hires
From your ATS, export the timestamp of: req posted, application submitted, recruiter screen completed, first interview held, panel held, decision recorded, offer extended, offer accepted.
If your ATS doesn't track all of these — particularly the decision-recorded timestamp — that's your first finding. You can't fix what you can't see.
Step 2 — Calculate stage durations
For each of the 10 hires, calculate the days between each consecutive timestamp. Build a small table with 7 columns (one per stage) and 10 rows (one per hire).
Step 3 — Find your outliers
For each stage, take the median across the 10 hires. Compare to the benchmark range in the table above. The stage with the largest absolute over-run versus benchmark is your bottleneck.
Step 4 — Map the bottleneck to a pattern
Match what you found to one of the four bottleneck patterns earlier in this piece (Screening, Scheduling, Decision, Offer). Each maps to a specific intervention.
Step 5 — Pilot one fix for 90 days
Don't try to fix everything at once. Pick the single biggest bottleneck, deploy the specific intervention, and run the audit again 90 days later. The change should be visible in the data, not just claimed by the vendor.
This whole process — Steps 1 through 4 — should take a Head of TA about three hours on a Monday afternoon. The fact that most teams never do it is, frankly, the most common reason hiring stays stuck at 44+ days.
What this means for HR leaders right now
Three things worth taking from this.
First, instrument before you automate. Buying AI ATS tools without running the audit is how teams end up with expensive software that doesn't move the needle. Find the bottleneck, then buy the specific intervention.
Second, the bottleneck moves over time. Fix the screening stage, and the new bottleneck becomes scheduling. Fix scheduling, and the new bottleneck becomes hiring manager decision latency. Each fix surfaces the next one. Plan for this as a 12 to 18-month operational sequence, not a one-time tool purchase.
Third, the boring stages matter most. Resume screening and interview scheduling are unglamorous. They don't get keynote slots at HR Tech conferences. But together they're where roughly 50% of teams' excess time-to-hire actually lives. The teams that win the AI ATS era are the ones that take the boring infrastructure work seriously — and reserve the human judgement for the stages where it actually matters.
Frequently asked questions
What is a good time-to-hire benchmark in 2026?
Global average sits at 44 days as of late 2025, up from 31 in 2023. A well-run mid-market team should target 25–30 days for knowledge-worker roles, 35–40 for senior or specialised roles, and 12–18 for high-volume hourly hiring. Targets vary substantially by industry — construction and retail move fastest, energy and professional services slowest.
What's the difference between time-to-hire and time-to-fill?
Time-to-hire measures the candidate journey (from when they apply to when they accept). Time-to-fill measures the business need (from when the req is opened to when the new hire starts). The gap between them is the candidate's notice period plus your onboarding readiness. Both metrics matter, but they have different root causes and different fixes.
How do I run a pipeline audit if my ATS doesn't track all 7 stages?
The fact that your ATS doesn't track a stage is itself a finding — usually the bottleneck is hiding precisely in the stages without timestamps. As a workaround, you can reconstruct timestamps from calendar invites, email logs, and offer letter records. Most modern AI ATS platforms track all 7 stages natively; if yours doesn't, that's likely part of why the bottleneck has been invisible.
What's the single highest-ROI fix for time-to-hire?
For roughly 60% of mid-market teams, AI-powered resume screening is the highest-ROI fix because it compresses the most-stretched stage (Application → Recruiter Screen) by 8 to 10 days on average. For the other 40%, it's interview scheduling automation or hiring manager decision discipline — but run the audit before you pick. The wrong fix for your specific bottleneck wastes both money and recruiter goodwill.
How long does it take to actually see improvement after a fix?
For automation-driven fixes (screening, scheduling, offer generation), you should see stage-level improvement within 30 days of deployment, with full impact by 90 days. For process-driven fixes (decision latency, feedback SLAs), expect 60 to 90 days because leadership behaviour takes longer to change than software does.
Continue exploring
- AI Applicant Tracking System: The 2026 Guide — the deep guide to the six AI capabilities mentioned across this article
- State of AI Recruiting in Asia 2026 — the regional adoption data behind these workflow shifts
- The Modern Recruiter's Day — the daily workflow shift that AI ATS enables, applicable to manufacturing recruiters processing high-volume applications
- The Hidden Cost of a 47-Day Hire — the pipeline audit framework adapted for manufacturing contexts
This Insights piece was prepared by Moka's research team. Benchmarks are drawn from EasyApply, Genius hiring data, SHRM, InterviewPal 2025 research, Pinpoint customer benchmarks, and aggregated, anonymised data from Moka's APAC enterprise customer base. To run a pipeline audit on your own team's data, book a personalised consultation.

Author
Moka AI Editorial Team
The Moka AI Editorial Team creates insightful, practical, and engaging content on HR, recruitment, and AI innovation. We explore emerging trends, share industry insights, and turn complex ideas into actionable knowledge to help HR professionals navigate the evolving world of work.